Democide in Canada, 2020-2022? Plus, the untapped mortality data goldmine
One thing we should all be able to agree on: the mortality data
In the US, information about deaths, such as when, where, and how the death occurred, age, gender, etc., is collected from death certificates issued nationwide, and stored in a central database known as WONDER. The contents of this database are not debatable, in the sense that everyone who does the same search in the database will always get exactly the same results.

Of course, there are debatable aspects of the mortality data, such as the complex issue of what the data means, as well as the integrity and reliability of the data. But those are deeper issues—first, you have to know what data is there, before you can analyze it, or dispute it. There is no reason whatsoever not to have complete agreement on what data is in the WONDER database.
The same is true of Canada’s official mortality data, but I want to qualify it a little. Canada has only a fraction of the deaths the US has, and does not have a central database of mortality data with extensive search capabilities, like the US does. Instead, Canada’s mortality data is only available in spreadsheets, and in written government reports. Therefore, search capabilities are more limited, and it isn’t possible to simply save a link to a search so others can easily verify it. It was also acknowledged that certain Canada death data, such as from Yukon province, was not available. Nevertheless, we should all be able to agree on the contents of Canada’s official mortality data, which is a matter of record, not a matter of opinion.
The untapped mortality data gold mine
In the United States, the official mortality data contains many clues about why 529,000 more people died in 2020 than in 2019—an unprecedented increase of 18.5%. The data suggests that a democide (mass-murder) may have occurred—or at the very least, that something besides a virus killed a half-million people in 2020, and another half-million in 2021.

It’s not just about the massive increase in deaths, it’s about the pattern of deaths (where and when excess deaths occurred), and the characteristics of the deaths (such as age, where they died, and the causes each death was attributed to). The data doesn’t really fit the official COVID19 narrative—nor does it fit many of the alternative narratives, either, such as the idea that iatrogenic treatment effects were responsible for more than a million deaths over 2 years.
I’ve barely scratched the surface of all there is to learn from the US mortality data—but it is plenty to go on for anyone who wants to see if their existing beliefs about excess deaths and their causes fit that data. A good place to start would be this summary of the research I’ve done on the characteristics of the death peaks, as well as the New York City mass casualty event—which makes a good litmus test for the viability of claims about excess deaths.
There are reasons to suspect the 2020 democide may have been worldwide. For example, huge simultaneous death spikes occurred in several different countries in Spring 2020—all similar to the New York City mass casualty event. That includes Canada, as I’ll show in this paper. I don’t know what followed the death spikes abroad, but I do know what followed in Canada and the US—and it was a lot more unexplained death.
Yearly deaths in Canada

Given its size, I was surprised at how few deaths occur in Canada, compared to the US. The grizzlies have a lot of land to themselves there, because Canada has a population of just 40 million, compared to 333 million in the US. Canada normally has only about a tenth the number of deaths the US has each year, along with a lower death rate.
Chart 1 shows yearly deaths in Canada from 2000—2023 (green columns), and the raw death rate per 100,000 (orange line). The raw death rate per 100,000 is calculated by dividing the number of deaths by the size of the population, and multiplying the result by 100,000. The numbers for 2023 are provisional and subject to change. (Notes 1, 2 and 3)
Deaths increased a lot in Canada in 2020—the number of deaths exceeded 300,000 for the first time, and the death rate per 100,000 exceeded 800, also for the first time. This was followed by another smaller increase in mortality in 2021. This pattern was similar to the US, although the increase in deaths in Canada was not as large.

Chart 1. Canada yearly deaths and death rate, 2000-2023. See Notes 1, 2 and 3.
However, in 2022, while deaths declined in the US, deaths surged to an all-time high in Canada. This was followed by a decline in mortality in 2023, in both Canada and the US.
The following tables show the number of deaths and the death rate in Canada (Table 1) and the US (Table 2) from 2000-2023, along with the change and percent change in deaths each year. The percent change in deaths each year is highlighted in tricolor, with the highest increases in red, and the lowest increases in green.
The 10-year average percent change in deaths in both Canada and the US from 2010-2019 was the same: 2%. The highest yearly increase during that time in Canada was 4%, in 2017, and in the US, it was 3%, in 2015 and 2017. Compare that to 2020, when deaths increased by 8% in Canada, and 19% in the US—and deaths would remain far higher than normal for the next few years.
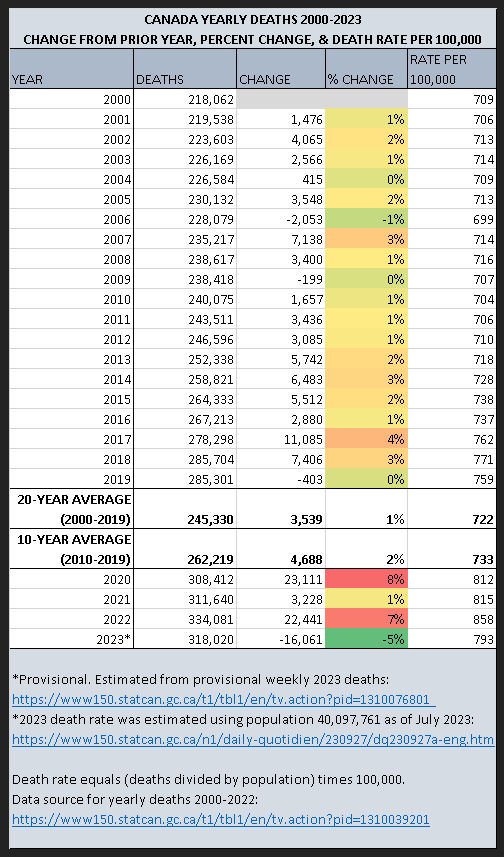
Table 1: Canada yearly deaths and death rate. See Notes 1, 2 and 3.
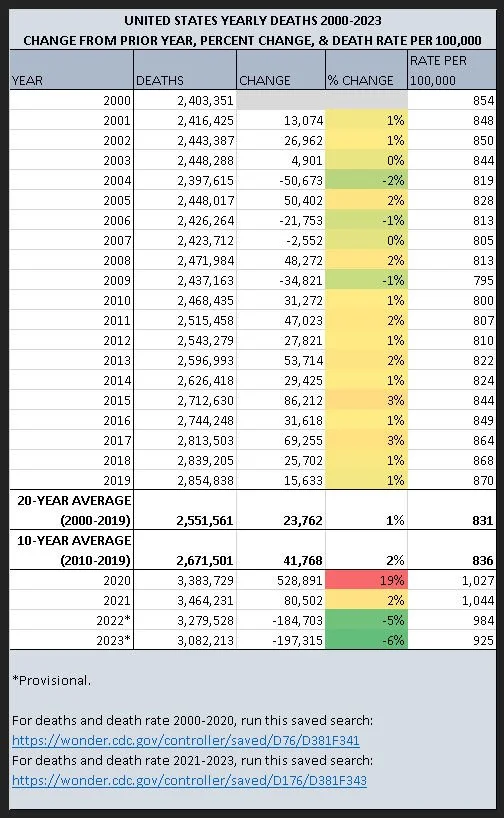
Table 2: US yearly deaths and death rate. See Note 4.
The Canada Spring 2020 mass casualty event
Like many other countries around the world, including the US, Canada had a dramatic spike in deaths in Spring 2020. Chart 2 compares weekly deaths in Canada in 2019 (white line) with weekly deaths in 2020 (red line). While there were a lot more deaths overall in 2020, many of them occurred in a large surge lasting from about Week 13 through Week 23 (11 weeks)—about the same time as the New York City mass casualty event. (Note 2)

Chart 2: Canada weekly all-cause deaths, 2019 compared to 2020. See Note 2.

Table 3: Excess deaths in Canada’s Spring 2020 mass casualty event. See Note 2.
Table 3 shows the number of deaths in the different provinces of Canada during the 11 week death surge, compared to the same period in 2019. In total, there were 9,445 excess deaths, a 16% increase compared to 2019. Most of the deaths occurred in Quebec and Ontario, with Quebec having by far the largest increase in deaths at 33%, nearly double the 17% increase in Ontario. (Note 2)
Both Quebec and Ontario are huge provinces, and I was not able to narrow down the location of the mass casualty event further, although it may be possible to do so with resources I haven’t found yet. Therefore, I can’t say at this time whether most of the excess deaths occurred in a small geographic region, like they did in the US, or not.
Charts 3 and 4 show the percent increase in deaths in 2020 in Quebec and Ontario. Excess deaths peaked in both places in Week 17, when there were 57% more deaths in Quebec than there were in the same week of 2019, and 31% more deaths in Ontario.

Chart 3: Quebec, Canada: Percent change in weekly deaths in 2020 compared to 2019. See Note 2.

Chart 4: Ontario, Canada: Percent change in weekly deaths in 2020 compared to 2019. See Note 2.
Weekly all-cause deaths in Canada, 2019-2023
Chart 5 shows weekly deaths in Canada from 2019-2023. As mentioned previously, deaths in Canada were highest in 2022 (yellow line), and began increasing in 2020 (red line) and 2021 (orange line). This was followed by a decline in deaths in 2023 (blue line), although deaths remained higher than they were in 2019. (Note 2)
There are a couple of notable anomalies in the pattern of deaths, in addition to the Spring 2020 mass casualty event. There was a large surge in deaths in early 2022, lasting from about Week 2 to Week 9 (8 weeks). There was also an odd spike in deaths in Week 27 of 2021.

Chart 5: Canada weekly deaths 2019-2023. See Note 2.
Deaths by age group, 2018-2022
Table 4 shows deaths by age group in Canada. On the left are the 5-year age groups Canada uses, followed by the number of deaths in each age group from 2018-2022. Since 2022 was the highest year for deaths in Canada, I compared that year to 2019, and these columns are highlighted in a green gradient. Historically, deaths increase with age (with the exception of infants under 1 year), and most deaths occur among the elderly. This was true in both 2019 and 2022. (Note 5)
I’ve previously written about the use of dialetheia in social engineering to confuse and mislead, which are statements that are both true and false. Table 4 provides a good opportunity to illustrate a common dialetheia, which is that “the pandemic” (whatever it actually was) primarily only affected the elderly. In one sense this is true, since most of the excess deaths in 2022 (last column, in blue gradient) occurred among the elderly—but the elderly die in far greater numbers every year. The dialetheia is false, in that younger and middle-aged adults actually had a much higher percentage increase in deaths (orange gradient column), as well a much higher increase in death rate (gold gradient column).
There was also a startling increase in deaths and death rate among children age 5-14—although the numbers were pretty small.

Table 4: Canada deaths by age group 2018-2022. See Note 5.
Final thoughts
Although this was just a bare overview of deaths in Canada, there were some strikingly similar patterns of excess deaths in both Canada and the US, including the huge death spike in Spring 2020, following the World Health Organization’s declaration of a global pandemic.
There was also the fact the deaths increased most, percentage-wise, among younger and middle-aged adults—eerily similar to the same pattern of deaths seen in the US. Do you believe in coincidences? Because, at least to my amateur eye, this seems like a very, very peculiar one.
I don’t know if the characteristics of the excess deaths in Canada are otherwise similar to the US excess deaths, but I suspect they may be—because they had the same cause, whatever it was. There is a summary of the research I’ve done on the characteristics of deaths during the US death peaks here—just in case anyone gets a crazy curiosity hair and decides to run with it.
One noticeable difference between Canada and US deaths was that the US did not have the startling 30%-31% increase in deaths among children age 5-14 that Canada had. It would be a lot more startling if it involved the number of deaths the US has each year, but it still looks worthy of further investigation.
***
NOTES:
1) Canada yearly deaths and death rate, 2000-2022: Statistics Canada. Table 13-10-0392-01 Deaths and age-specific mortality rates, by selected grouped causes. https://www150.statcan.gc.ca/t1/tbl1/en/tv.action?pid=1310039201
2) Canada weekly deaths 2019-2023: Statistics Canada. Table 13-10-0768-01 Provisional weekly death counts, by age group and sex https://www150.statcan.gc.ca/t1/tbl1/en/tv.action?pid=1310076801
3) Canada yearly deaths for 2023 were estimated using the weekly death totals. 2023 death rate was estimated using population 40,097,761 as of July 2023, found here: https://www150.statcan.gc.ca/n1/daily-quotidien/230927/dq230927a-eng.htm
4) US yearly deaths and death rate: For deaths and death rate 2000-2020, run this saved search: https://wonder.cdc.gov/controller/saved/D76/D381F341. For deaths and death rate 2021-2023, run this saved search: https://wonder.cdc.gov/controller/saved/D176/D381F343
5) Deaths by age group 2018-2022: Statistics Canada. Table 13-10-0392-01 Deaths and age-specific mortality rates, by selected grouped causes https://www150.statcan.gc.ca/t1/tbl1/en/tv.action?pid=1310039201