Buy the Guide on Amazon
Available in Kindle ($9.95) and full color paperback ($24.95)

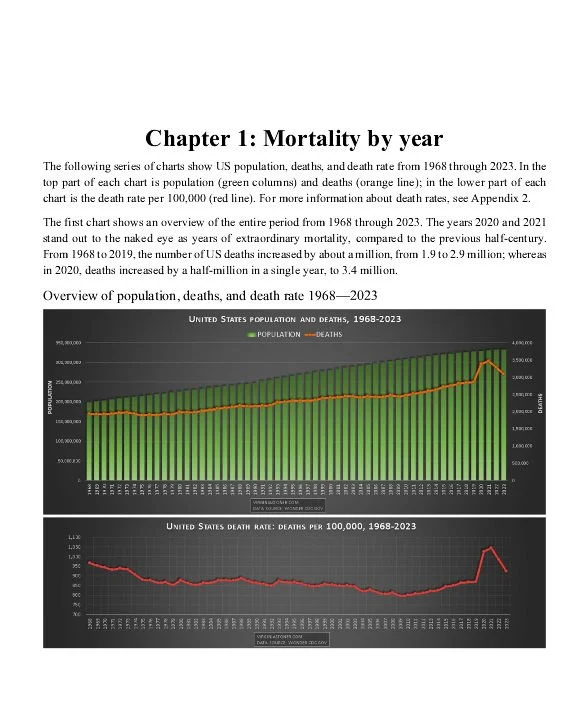
The Illustrated US Mortality Guide (the “Guide”) summarizes the official US mortality data (contained in a publicly accessible database called WONDER), with a special focus on the historic years of 2020 (“the year of COVID-19”) and 2021 (“the year of the vaccine”). Using colorful charts, concise descriptions, and informative tables, the Guide makes it easy to understand years of mortality data in minutes.
The Guide contains no opinions about the mortality data, no conclusions about what the data means, and no statistical analyses—just the raw numbers, supplemented with a little basic math, as needed to make comparisons between years, which the WONDER database will not do on its own.
The Guide is ideal for everyone from those with a casual interest in US deaths, to students and professionals looking for a reliable reference for official mortality data, or a springboard for further research.
Read a generous sample of the Guide on the Amazon Kindle version that includes the Table of Contents, Introduction, Chapter 1 in its entirety, and part of Chapter 2.
Content Previews and Supplements
First page of all 6 chapters
See the first page of every chapter of the Guide, including mortality by year, month, week, and state, the 15 leading causes of death, and the New York City mass casualty event of Spring 2020.

Chapter 6: The New York City mass casualty event
In April 2020, deaths increased by 202% in New Jersey, and 227% in New York State—by far the largest increases in death in any state in the US that year, or any year since. This death spike resulted in more than 50,000 unexplained deaths in 25 counties in the New York City metropolitan area over 8 weeks—after which deaths returned to normal. Read Chapter 6 in its entirety.

Why I wrote the Guide
I took a special interest in US mortality a few years ago, after noticing there were many vague and conflicting claims about US deaths in mainstream and alternative media—especially deaths in 2020 (“the year of COVID-19”) and 2021 (“the year of the vaccine”). Almost all ignored the official mortality data, as if deaths were a matter of opinion, or something determined by impressions or feelings.
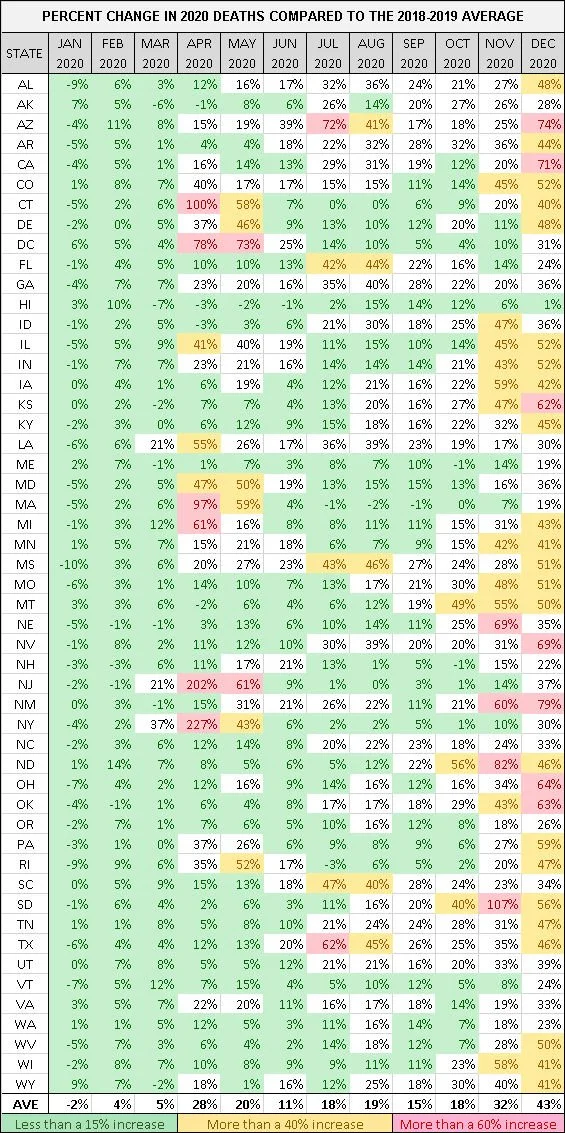
Deaths by state and month tables
Chapter 4 of the Guide contains 3 tables showing how much deaths changed in every state, each month in the years 2020, 2021, and 2022, compared to the monthly average in 2018-2019. These tables had to be abbreviated to a half-year in the digital version, which doesn’t seem to like large tables. Because I think these tables are important, I’m posting them here in full, to ensure they are available to everyone.