This is an update on how death rates for each age group have changed since pre-Covid days. In this article, I cover US death rates by 10-year age groups from 2018 thru 2024. The good news is that, out of 11 age groups, 7 ended up in 2024 with about the same or a little lower death rate than they had in 2018. The bad news is that the 4 remaining age groups ended up in 2024 with a substantially higher death rate than they had in 2018—and sadly, those age groups include young children aged 1-4 and 5-14, along with adults aged 35-44 and 85+.
Read MoreIn my last post, I identified the months and states where the highest increases in deaths occurred in the United States in 2020 and 2021—the peaks of the death waves. We saw that overall, 90% of excess deaths occurred in 3 places: among inpatients in medical facilities (55%); at home (23%); and in nursing homes and long term care facilities (12%). In this post, I look at excess deaths by age group during the death peaks, and as usual, find some strange and surprising things. I also provide an update on the coverup of excess US deaths, with a spurious claim by Dr. Jessica Hockett that mortality data was fabricated, and from Dr. Pierre Kory , a “debate” about a false dichotomy that excludes the possibility of democide.
Read MoreAlthough older ages died in higher numbers, the 35-44-year age group had by far the largest percentage increase in deaths— a 36% increase over 2019, and a 44% increase over the 5-year average. In total, there were up to 104,000 more deaths than usual, and the numbers still have not returned to normal. In this paper I look exclusively at deaths in the 35-44-year age group: How have the 15 Leading Causes of Death Changed, and why? The data has some very strange surprises.
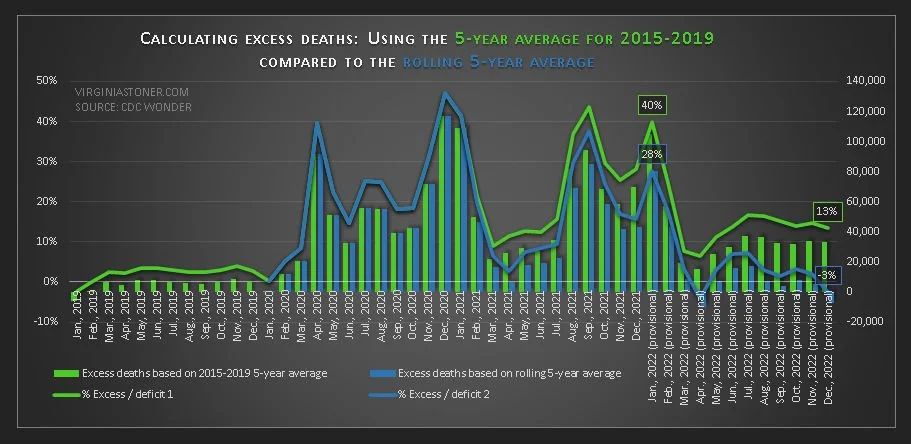
Read MoreThe CDC’s long overdue update on deaths in the US is finally in—2022 numbers are complete (but not finalized) in the WONDER database, and 2021 numbers are finalized. Some things are especially disturbing; for example, excess deaths in the 35-44 year age group were a stunning 43% higher than expected. I also explain why I use 2015-2019 mortality data to calculate excess deaths, and explain why using a 5-year rolling average normalizes excess deaths.
Read MoreIf it seems like more young people than usual are dying these days, it’s because they are. If anyone tells you otherwise, they either don’t know what they’re talking about, or they’re lying. Surprisingly, these excess deaths have disproportionally effected young people. In this paper I discuss excess deaths in the US by age group, from the CDC WONDER database.
Read More


