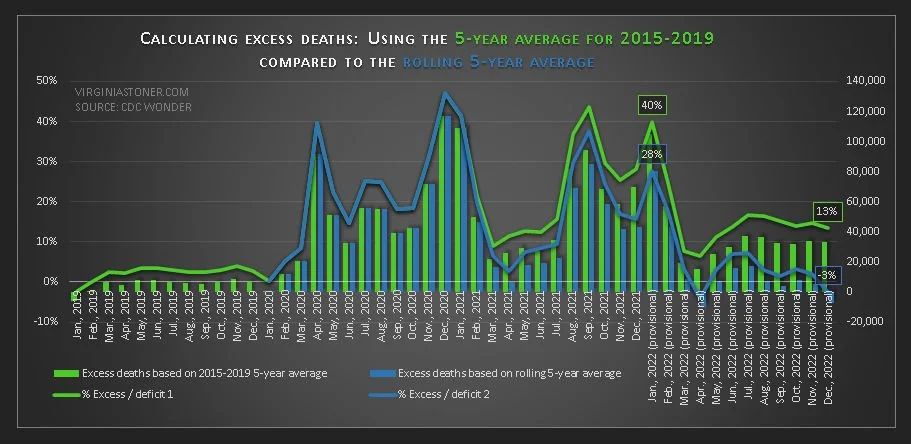
Before 2020, deaths had a remarkably consistent seasonal pattern in the US. This predictable pattern went totally wonky in 2020, and stayed strange through at least early 2022. Why? I think this disruption in the usual pattern of deaths can provide important clues about what really happened to cause deaths to increase. In this paper I look at the the third of four extraordinary “death surges” that occurred from 2020-2022—this one in August 2021—and consider its possible implications.
Read MoreThe second of 4 death surges that occurred in the US from 2020 through 2022 started in December 2020 and continued for about 13 weeks. This death surge resulted in almost 285,000 excess deaths, compared to the same period a year earlier. Like the April 2020 death surge, it disproportionally affected one state—but strangely, it was an entirely different state, on the opposite side of the country. In this post I look at the numbers for the December 2020 death surge, and I have some more information about the April 2020 death surge as well.
Read MoreAfter my last paper on the April 2020 death surge, I looked deeper and discovered something shocking: the 135,000 excess deaths in the US during the surge occurred almost exclusively in New York and New Jersey. Because the death surge was so localized, 4 out of 5 of the possible explanations I proposed for it don’t really fit! Plus, there’s a new chart comparing the death rate in each state for 2019, 2020, 2021 and 2022. There are a few standouts among the states—but not necessarily for the right reasons.
Read MoreThere have been 1.7 million excess deaths in the US in the last few years, starting with a sudden surge of deaths in April 2020. This death surge is ignored a lot in both mainstream and alternative media, because it doesn’t neatly fit anyone’s narrative. This paper takes a closer look at that first death surge, considers the possible causes, and identifies 4 distinct “death surges” that occurred from 2020-2022. It also looks at deaths by gender among 25-44 year olds—an age group where twice as many men die than women.
Read MoreThe CDC’s long overdue update on deaths in the US is finally in—2022 numbers are complete (but not finalized) in the WONDER database, and 2021 numbers are finalized. Some things are especially disturbing; for example, excess deaths in the 35-44 year age group were a stunning 43% higher than expected. I also explain why I use 2015-2019 mortality data to calculate excess deaths, and explain why using a 5-year rolling average normalizes excess deaths.
Read MoreIf it seems like more young people than usual are dying these days, it’s because they are. If anyone tells you otherwise, they either don’t know what they’re talking about, or they’re lying. Surprisingly, these excess deaths have disproportionally effected young people. In this paper I discuss excess deaths in the US by age group, from the CDC WONDER database.
Read More